Find meaning in your data
Transform complex datasets into clear, actionable insights with SimTheory's powerful visualization tools. Easily create interactive charts, maps, and dashboards that reveal patterns and tell compelling stories with your data.
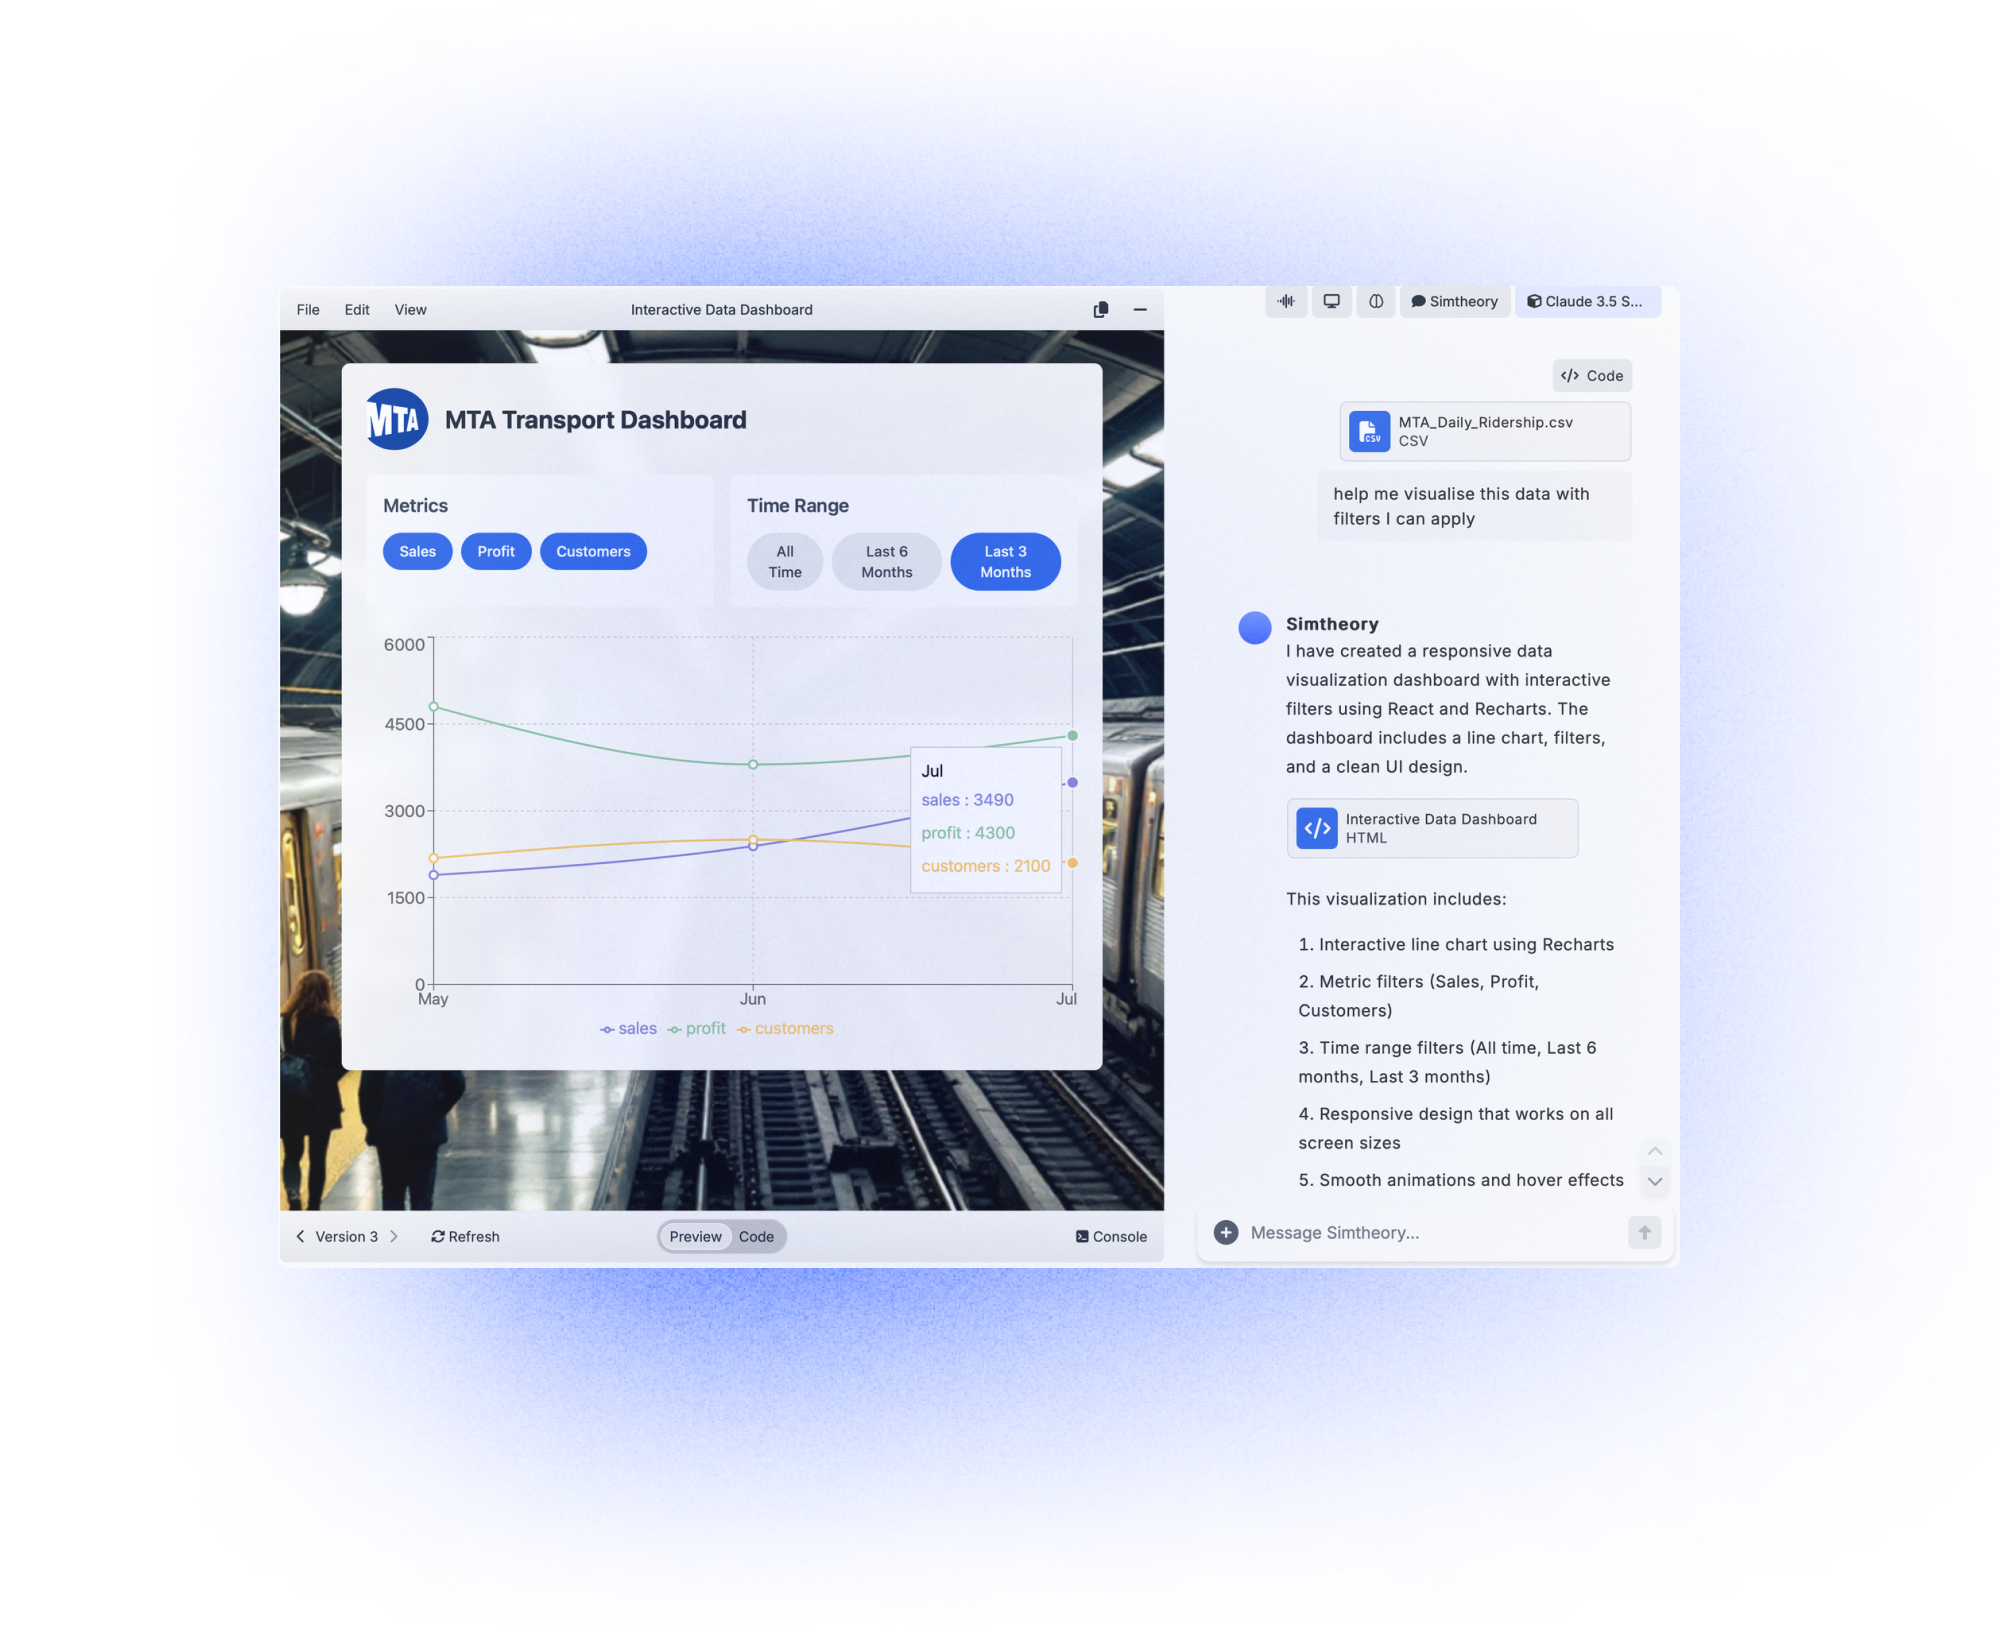
Interactive visualizations in seconds
Simply upload your data files, paste tables, or drag PDFs directly into your workspace. SimTheory automatically analyzes your data and suggests the most effective visualization types. Customize colors, labels, and layouts with simple commands or clicks.
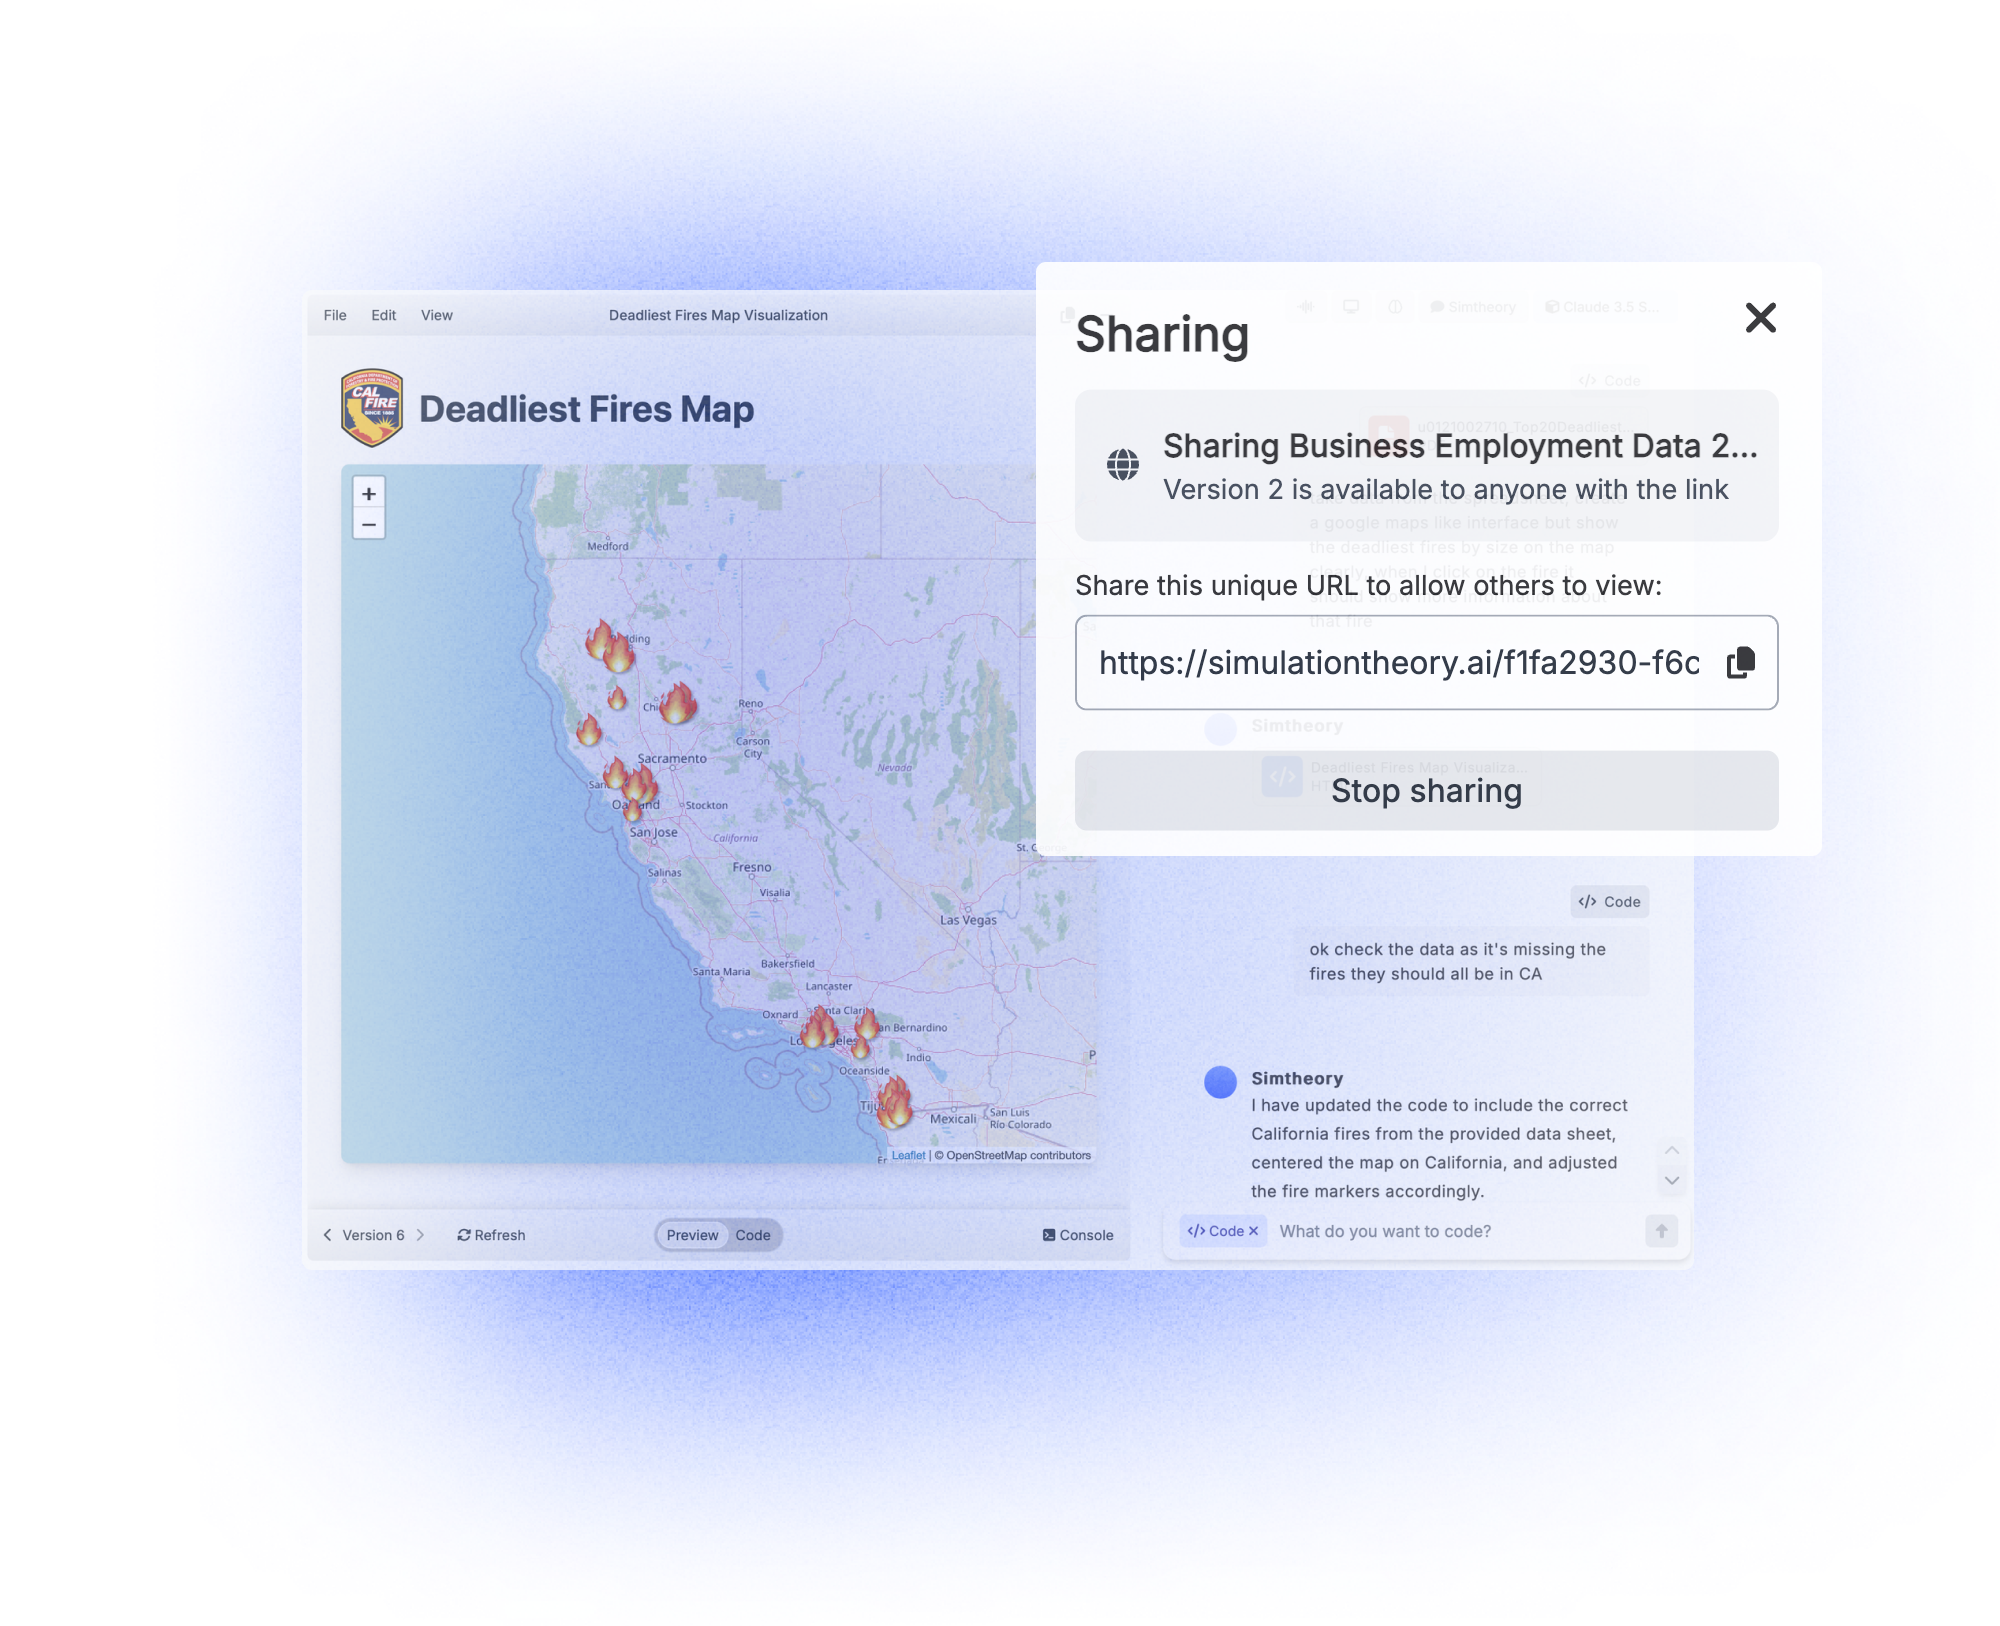
Share insights with anyone
Create beautiful, interactive dashboards that can be shared with your team or published to the web. Export visualizations in multiple formats or embed them directly in your presentations and reports for maximum impact.